Australian market · Network analysis
EnergyConnect: looking beyond the price spread
A new transmission loop challenges the instinct to read electricity flows from regional prices alone. For battery and portfolio teams, the better question is what the network allows next—and how quickly that can change.
A network change becomes a trading question
When a region with a higher spot price exports to one with a lower price, a simple arbitrage model appears to have broken. In a constrained electricity system, the more useful interpretation is that the regional spread is showing only part of the decision.
EnergyConnect introduces a transmission loop between New South Wales, Victoria and South Australia. AEMO brought the new interconnector into its dispatch arrangements from 1 October 2026, with transfer capability increasing progressively as testing permits. Market integration should not be confused with full commissioned capacity. AEMO’s EnergyConnect update ↗
For a trading desk, this changes the questions worth asking. A flow may support efficient dispatch while looking unattractive at regional reference prices. A battery may face a strong local opportunity while the interconnector story points in an apparently contradictory direction. Reading the price, flow and constraint together becomes essential.
What the October event tells us—and what it does not
At 09:20 AEST on 4 October, published analysis recorded NSW at A$11.88/MWh, Victoria at A$2.10/MWh and South Australia at A$0.50/MWh, while scheduled transfers on the central links ran towards lower-priced regions. That is a useful example of the limits of a spread-only explanation. Allan O’Neil’s contemporaneous WattClarity analysis ↗
Our focus is the decision that follows: whether the configuration persists, which constraint is setting the limit and how the next change could affect an exposed portfolio. One interval does not establish a repeatable trade, a forecast error or an inefficient dispatch outcome.
Trade the change in the constraint, not the shape of the arrow
AEMO uses loop equations to align scheduled transfers with the physical relationships in the network. Those equations sit alongside thermal and security limits. Increasing a scheduled transfer on one link can require adjustments elsewhere; the links cannot be treated as independent pipes. AEMO EnergyConnect FAQs ↗
This suggests a different analytical priority. Start with the limits that are binding, then examine which changes could relax or tighten them. Outage conditions, generation patterns and available supply can alter the feasible dispatch. The regional spread is an outcome of that system, not a complete instruction for where power ought to go.
For batteries, the implication is about optionality. An apparently weak discharge window can become more attractive if imports become constrained. Conversely, an expected premium can fade if transfer capability or local supply improves. These are conditional scenarios to test against the asset’s energy and commitments, not automatic trading signals.
Price and transfer
Read the relevant region, interval and sign convention together.
The binding limit
Inspect equation terms, marginal value and available definition coverage.
The next feasible move
Test the forecast against changed limits, supply and asset flexibility.
Use marginal values with the right question
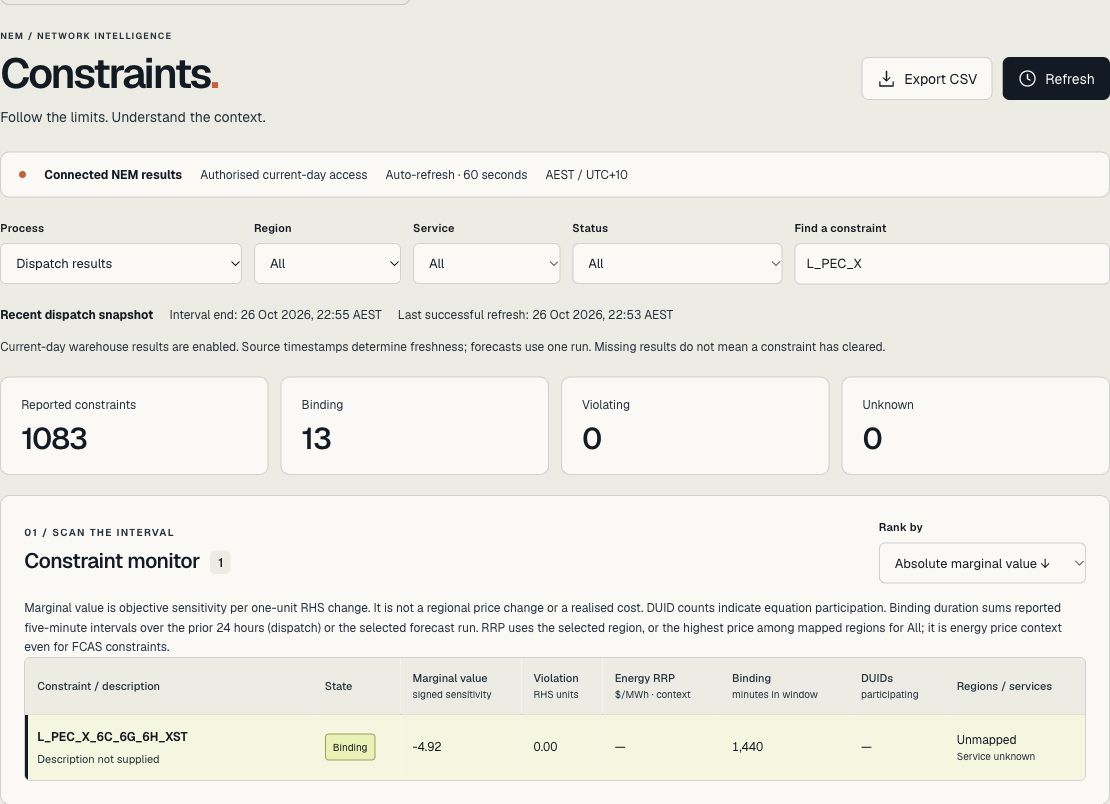
GridTrace’s Constraints workspace brings constraint status, equation context, marginal values and regional price context into a common view. Its purpose is to help a desk move from seeing a surprising outcome to investigating the mechanism behind it.
A constraint marginal value describes sensitivity in the dispatch optimisation. It is not the revenue a battery earns, nor a standalone prediction of the next regional price. Multiplying a marginal value by a relevant equation factor can help explain a constraint’s contribution, but only with the correct interval, sign and complete set of binding constraints. Losses and other dispatch conditions still matter. AEMO Electricity Data Model: interconnector constraint contribution fields ↗
That distinction is commercially useful. A dramatic number on a constraint screen deserves investigation; it should not be converted directly into expected trading profit.
Connect the explanation to the next decision
Our recommended workflow links three GridTrace views: the Constraints workspace for the network mechanism; the spot forecast for the developing price path; and Risk Radar for the possibility of more extreme outcomes. The desk then tests what those scenarios mean for its own position.
The most useful question is specific: if this limit persists into the next delivery window, what changes in the plan—and what evidence would reverse that judgement? That turns an interesting market picture into an accountable decision process.
A regional spread tells you where prices differ. Network context helps you understand what could change next.
EnergyConnect adds another reason to bring forecasting, market observation and commercial judgement together. GridTrace is built to make that conversation clearer.
Bring us your next decision
A clearer view. A stronger trading conversation.
Talk to a team with 40+ years of combined electricity market experience, specialising in Australian and Japanese markets.
Talk to GridTrace ← Back to the three insights