Australian market · Battery analytics
Templers: a closer look at battery performance
Since September 2026, GridTrace Analytics tools have supported the trading of Templers BESS. A leading result in the latest published South Australian revenue-per-MW comparison brings the value of informed decisions into focus.
Estimated gross market revenue per MW
Estimated gross market revenue
Compared with 55% for the tracked SA fleet
1–25 October 2026. Source: NEMPulse’s published South Australian comparison, accessed 26 October. Values are estimates, not audited profit.
A leading result, measured precisely
A battery’s opportunity changes with every forecast revision, dispatch interval and shift in available supply. Capturing it requires a clear view of the next price window and the uncertainty around it. Since September 2026, GridTrace Analytics has supported the trading of Templers BESS with tools designed to bring those decisions into focus.
For 1–25 October, Templers recorded the highest estimated revenue per MW among the 12 assets listed in NEMPulse’s South Australian table. It ranked second on total estimated revenue, behind Blyth. The comparison makes Templers a compelling example of strong battery trading performance, while keeping the metric and period explicit. View the external comparison ↗
The result belongs to the asset and reflects trading decisions, physical capability, market conditions and operating obligations. GridTrace’s role is to support the decisions with a clearer evidence base.
See the shape of the opportunity
The GridTrace spot forecast model provides a 24-hour price curve refreshed every five minutes, alongside actual dispatch prices and an AEMO predispatch comparison frozen at the forecast’s issue time.
That frozen comparison matters. Replacing an earlier forecast with a newer one can obscure what a trader knew at the decision point. Preserving the original view makes it easier to examine when an opportunity became visible, how expectations moved and where the forecast missed.
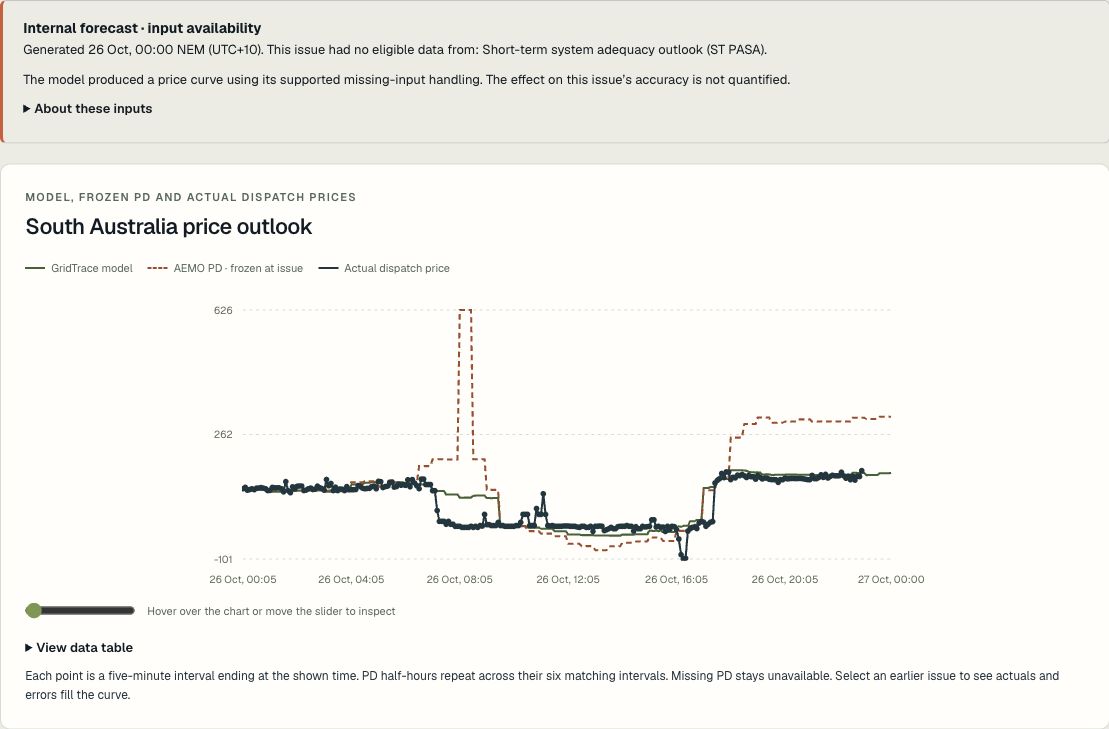
For a battery team, the practical starting point is the shape of the next day: prospective charging windows, stronger-price periods and the rate at which those expectations change. The next step is to test the asset’s available energy, operating limits and commitments. The curve informs the judgement; the physical and commercial position determines what is feasible.
Keep the tails in the conversation
A central price path cannot express every outcome that matters. GridTrace’s Risk Radar adds a separate view of South Australian price-event probabilities across rolling 30-minute windows, through a 96-hour horizon.
It assesses the chance of at least one five-minute price at or above A$1,000/MWh, or at or below −A$100/MWh, within each window. Those probabilities are not price targets. Adjacent windows overlap and must not be added together.
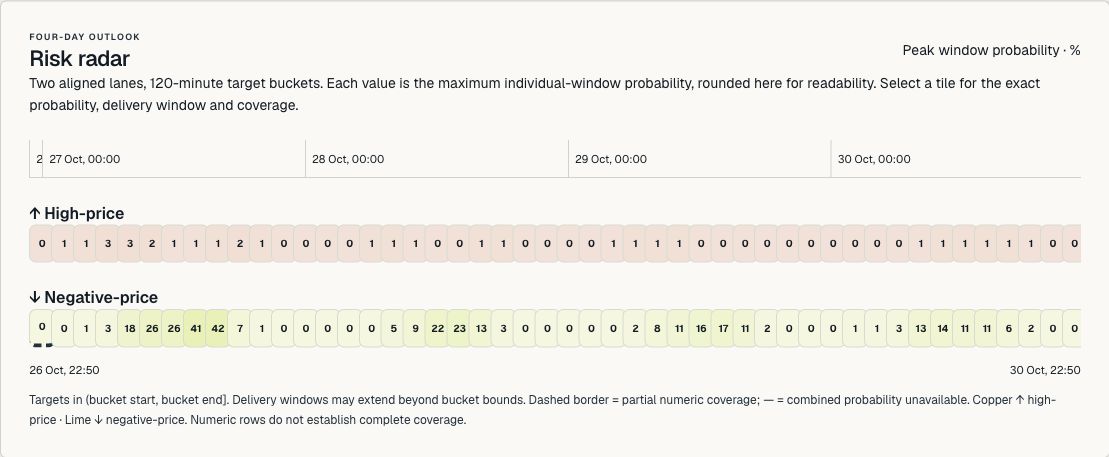
Together, the two views help challenge a schedule before the market forces a decision. Does the possibility of a later event justify retaining flexibility? Does negative-price risk deserve closer attention? Has the opportunity moved enough to revisit the plan? These are examples of how the tools can be used, rather than claims about individual executed Templers trades.
Make review part of the trading process
HDRE describes Templers as a 111 MW / 330 MWh project commissioned on 5 December 2025. That scale makes disciplined evaluation valuable across everyday decisions as well as exceptional intervals. HDRE capital-markets update, page 2 ↗
GridTrace brings forecasting, event-risk assessment and review into one working environment. For owners and trading teams, the proposition is practical: clearer evidence before the decision, better visibility as conditions develop and a more useful record afterwards.
See the price path. Understand the risk around it. Make the next decision with context.
Bring us your next decision
A clearer view. A stronger trading conversation.
Talk to a team with 40+ years of combined electricity market experience, specialising in Australian and Japanese markets.
Talk to GridTrace ← Back to the three insights